
Technicals
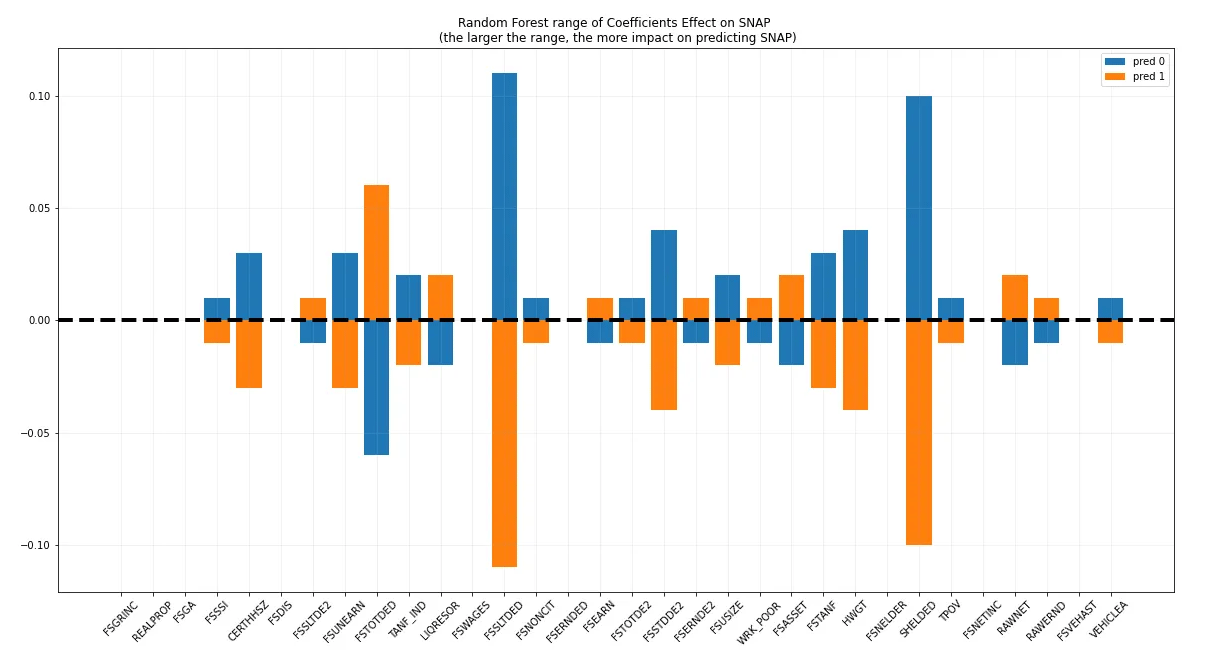
I wanted to do a 10-year gap analysis, emphasizing the effect of the 2008 housing crisis, so I used datasets from 2007 and 2017 to build the model. I first focused on New Mexico as an emerging hot spot and Nebraska as an emerging cold spot, determined in a previous GIS spatial analysis, to highlight extreme, contrasting states. I started off with over 40k rows and 800 columns in each dataset, and using a combination of correlation, high nullity, data insight, and domain knowledge I whittled the data down to 33 columns and a final dataset of 4k records, optimizing with python reference scripts for frequently used code. I used a Vote Ensemble with Random Forest, Gradient Boost, and Bagging Classifier ending in a final CV score of 95%.